In the first tutorial, we visualized our customers' data in the map. We added a simple metric and a simple indicator which worked with one dataset.
In this tutorial, we'll add more datasets to the project, take a look at the data model and learn how to work with data dimensions.
What you'll create
We will extend the existing dotmap and heatmap visualizations, and add a new one - areas.
|
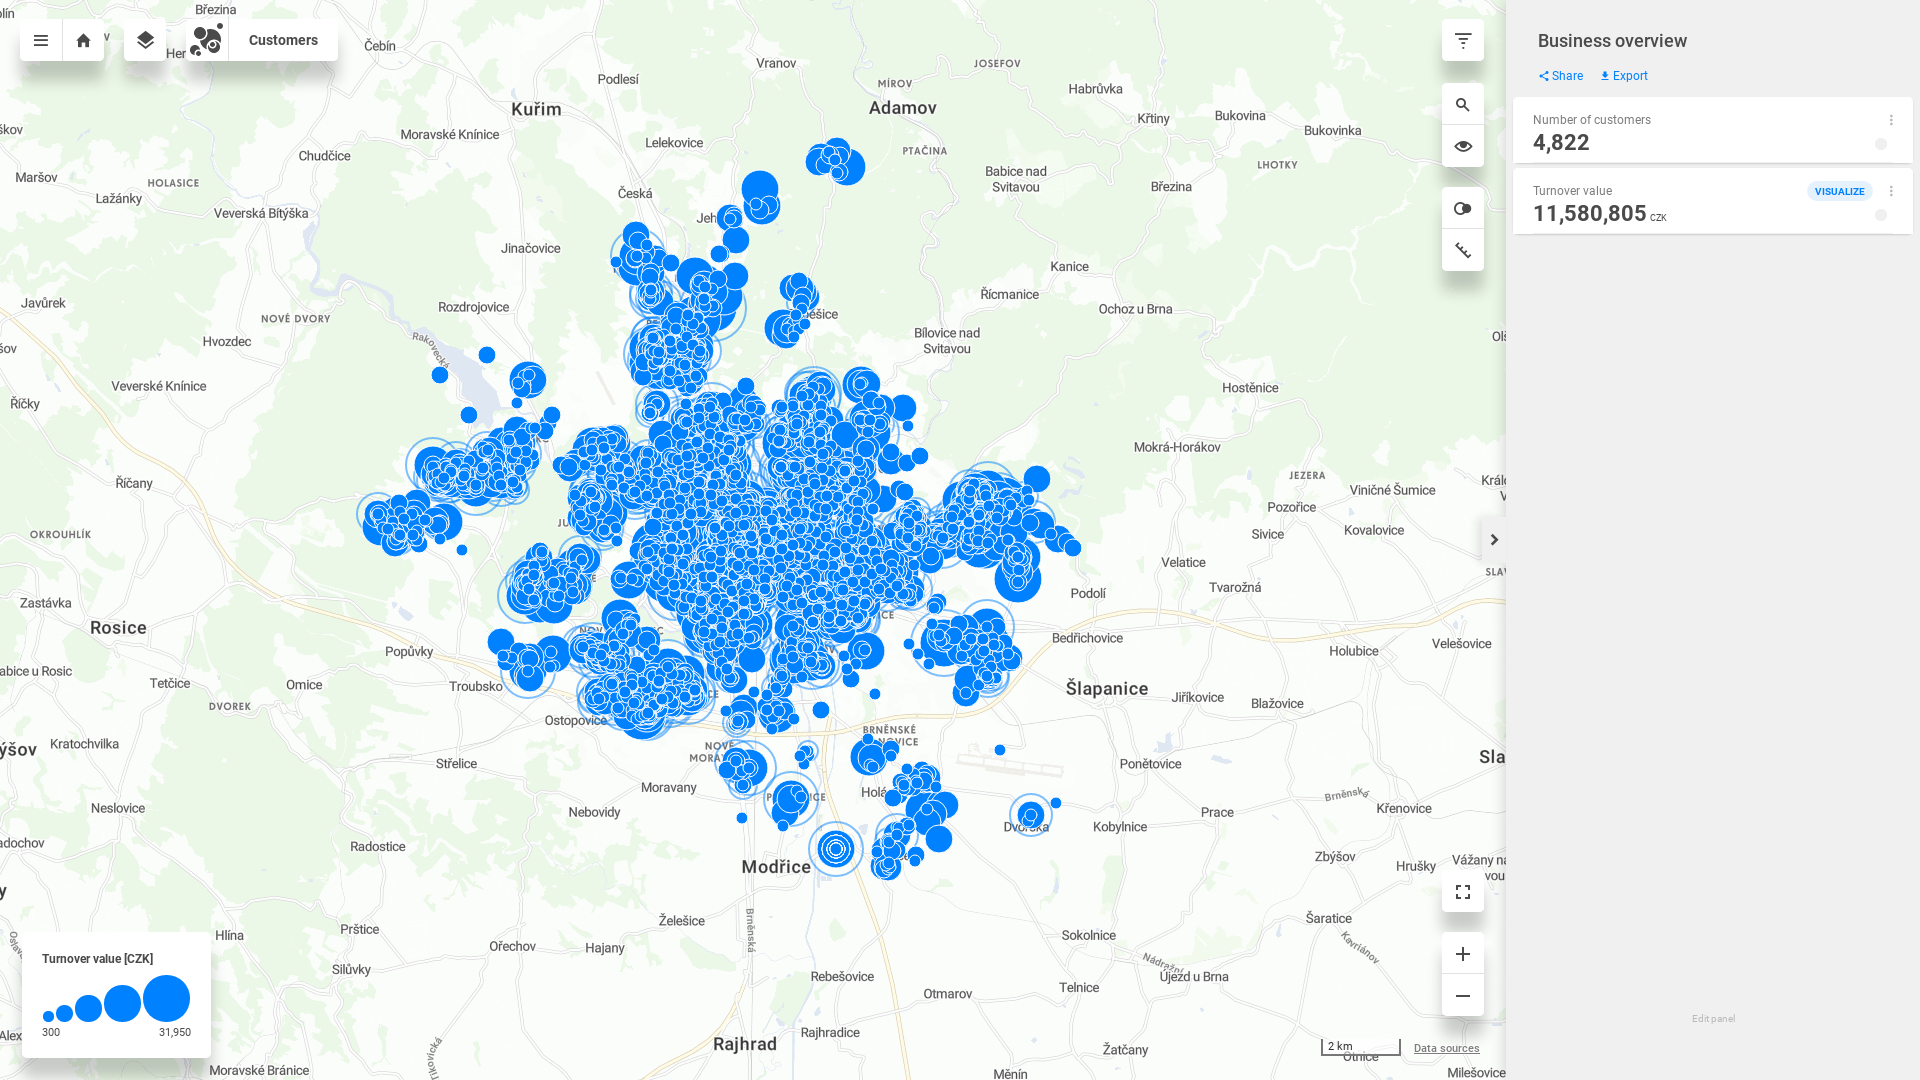
Turnover value aggregated to customer addresses |
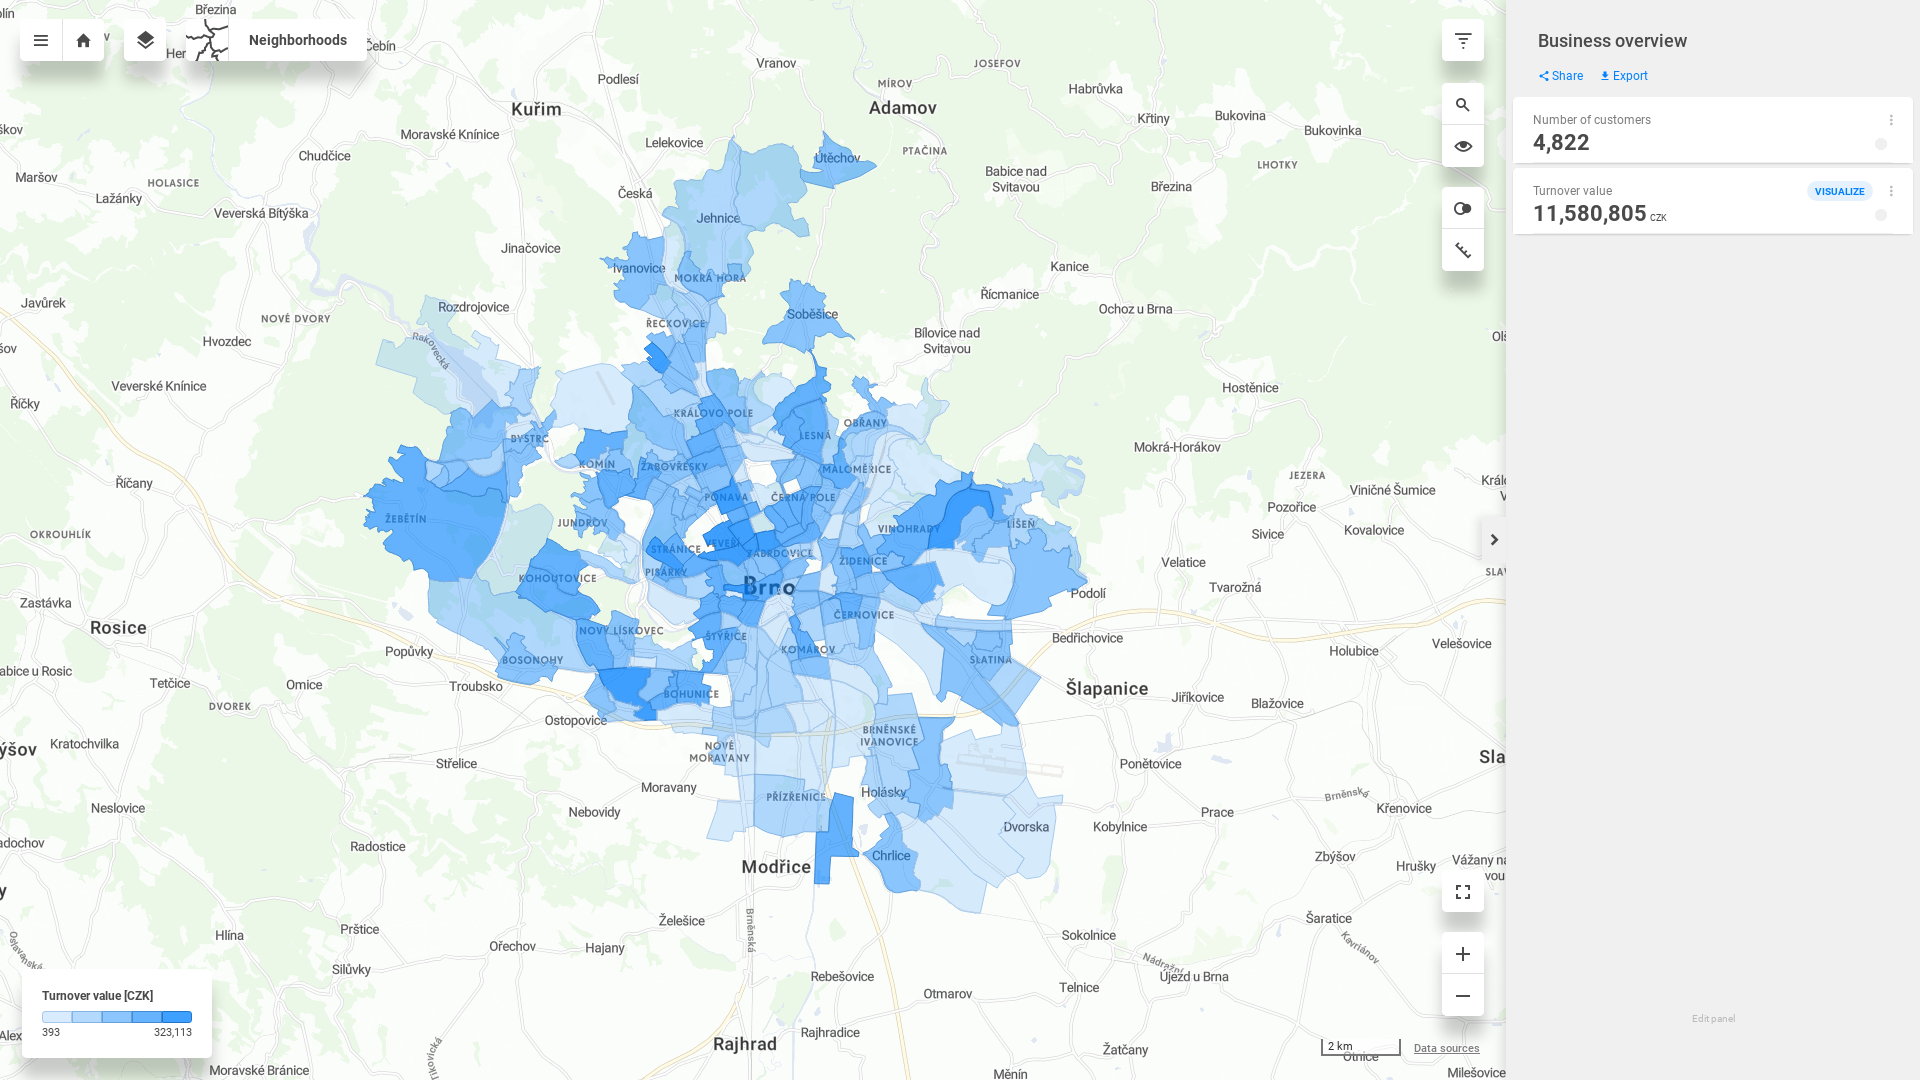
Turnover value aggregated to administrative units |
|---|---|
|
|
Transactions table
The CSV file can be downloaded here: transactions.csv
|
Name |
Title |
Data type |
|---|---|---|
|
|
Transaction ID |
integer |
|
|
Customer ID |
integer |
|
|
Store ID |
integer |
|
|
Date of the transaction |
date |
|
|
Transaction amount |
decimal |
|
|
Week day index |
integer |
|
|
Week day |
string |
|
|
Hour index |
integer |
|
|
Time category |
string |
|
|
Channel (online/offline) |
string |
Download the CSV file and put it in the /data folder of your dump.
Transactions dataset
Let's have a look at dataset corresponding to the transactions table. Few things to note:
-
its
subtypeisbasic, because it does not contain any geospatial information-
therefore, it does not contain
properties.featureTitleetc.
-
-
on the
customer_idproperty, there'sforeignKeyto thecustomersdataset-
so this property is linked to the primary key (Customer ID) of the
customersdataset
-
-
the dataset is
categorizable, and has somefilterableproperties (more later)
Transactions dataset syntax
{
    "name": "transactions",
    "type": "dataset",
    "title": "Transactions",
    "description": "Online and offline transactions done by our customers.",
    "ref": {
        "type": "dwh",
        "subtype": "basic",
        "primaryKey": "transaction_id",
        "categorizable": true,
        "fullTextIndex": false,
        "properties": [
            {
                "name": "transaction_id",
                "title": "Transaction ID",
                "column": "transaction_id",
                "type": "integer",
                "filterable": false
            },
            {
                "foreignKey": "customers",
                "name": "customer_id",
                "title": "Customer ID",
                "column": "customer_id",
                "type": "integer",
                "filterable": false
            },
            {
                "name": "store_id",
                "title": "Store ID",
                "column": "store_id",
                "type": "integer",
                "filterable": false
            },
            {
                "name": "date",
                "title": "Date",
                "column": "date",
                "type": "date",
                "filterable": true
            },
            {
                "name": "amount",
                "title": "Amount",
                "column": "amount",
                "type": "decimal(19,6)",
                "filterable": true
            },
            {
                "name": "day_index",
                "title": "Week day index",
                "column": "day_index",
                "type": "integer",
                "filterable": false
            },
            {
                "name": "day_name",
                "title": "Week day",
                "column": "day_name",
                "type": "string",
                "filterable": true
            },
            {
                "name": "hour",
                "title": "Hour index",
                "column": "hour",
                "type": "integer",
                "filterable": false
            },
            {
                "name": "time_category",
                "title": "Time category",
                "column": "time_category",
                "type": "string",
                "filterable": true
            },
            {
                "name": "channel",
                "title": "Channel (online/offline)",
                "column": "channel",
                "type": "string",
                "filterable": true
            }
        ]
    }
}
Save dataset as transactions.json and use addMetadata and pushProject to add the dataset and upload the data.
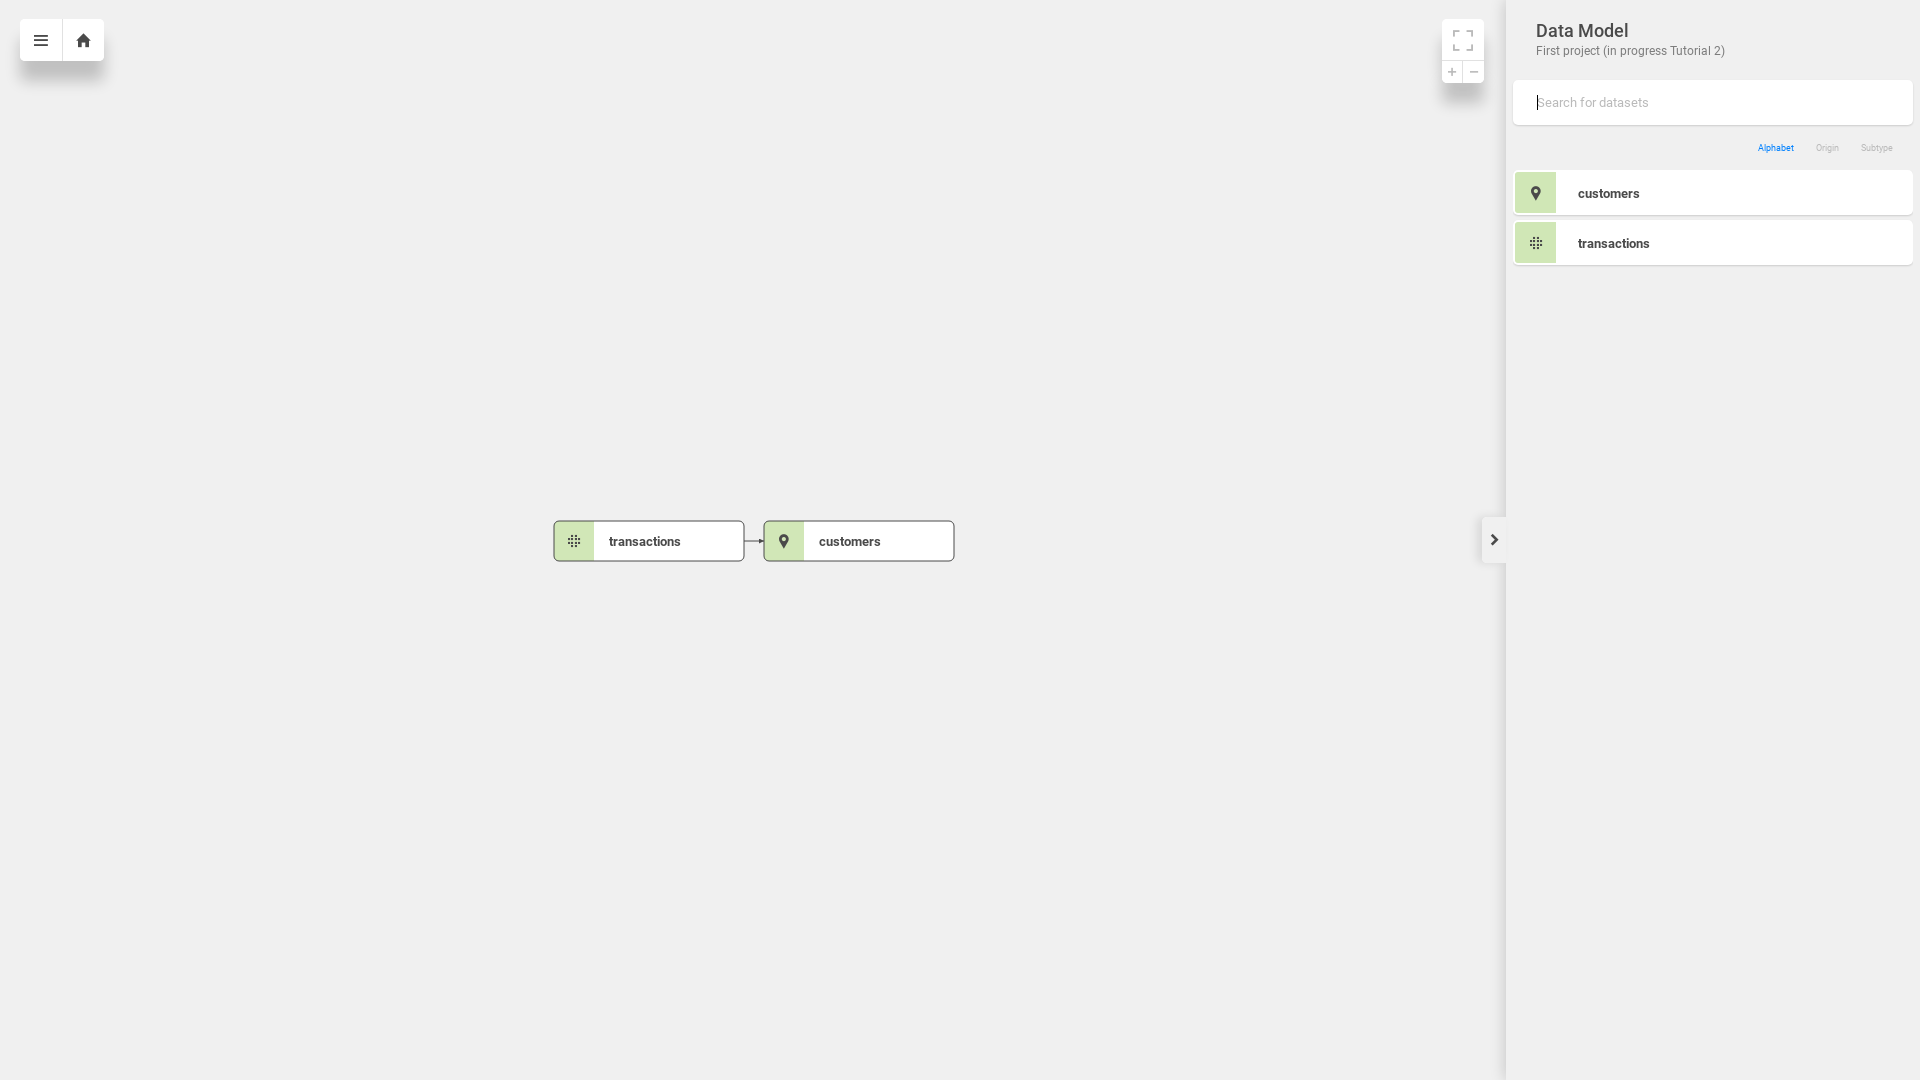
Data model
Each CleverMaps project is based on its data model. Visualization of the data model can be viewed:
-
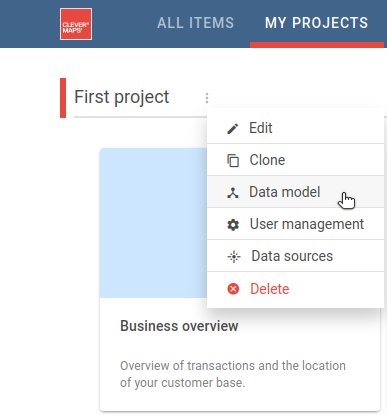
by clicking three-dot icon next to the project title on a Project page, and selecting the Data model
-
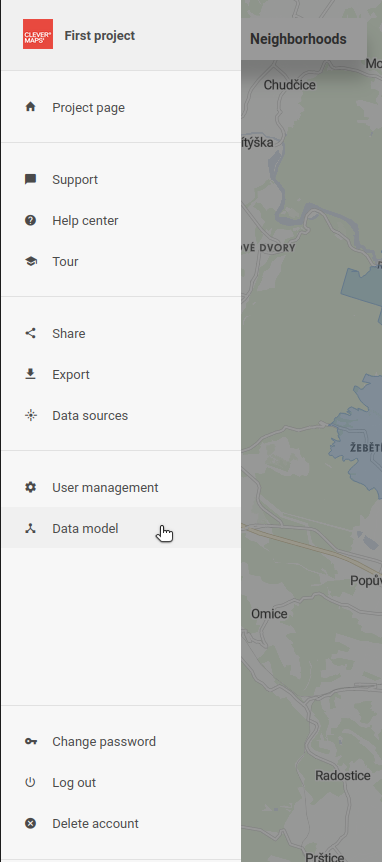
by clicking on Menu in the top left and selecting Data model from the map
Please note that the visualization of data model is available only to users with the Admin user role.
So, after we've added the transactions dataset, our data model consists of 2 datasets. They are native to this project, so they have a green label. You can also see that transactions dataset is linked to customers dataset using the customer_id foreign key.
Visualizing turnover
Now we can visualize the turnover generated by our customers. We will use the copyMetadata command to create a copy of the existing customers_metric.json and customers_indicator.json objects and modify them before we add them to the project.
tomas.schmidl@secure.clevermaps.io/project:k5t8mf2a80tay2ng/dump:$ copyMetadata --objectName customers_metric --newName turnover_metric
Object turnover_metric.json successfully created as a copy of object customers_metric.json

tomas.schmidl@secure.clevermaps.io/project:k5t8mf2a80tay2ng/dump:$ copyMetadata --objectName customers_indicator --newName turnover_indicator
Object turnover_indicator.json successfully created as a copy of object customers_indicator.json
The copied objects have a new name property and a new filename. But we still need to change these fields:
turnover_metric.json:
-
change
content.typetofunction_sum -
change
content.content[0].valuetotransactions.amount
turnover_indicator.json:
-
change
titleto "Turnover value" -
change
descriptionto "Total turnover value of all transactions" -
change
content.metricreference toturnover_metric -
add
content.format.symbolkey with the "CZK" value
Add the objects using addMetadata, and modify business_overview_dashboard so it contains a reference to turnover_indicator. It should look like this:
Updated transactions dashboard syntax
{
    "id": "j2idsg8tq7icp62f",
    "name": "business_overview_dashboard",
    "type": "dashboard",
    "content": {
        "blockRows": [
            {
                "type": "indicator",
                "indicator": "/rest/projects/$projectId/md/indicators?name=customers_indicator",
                "indicatorDrill": "/rest/projects/$projectId/md/indicatorDrills?name=empty_indicator_drill",
                "layout": "primary"
            },
            {
                "type": "indicator",
                "indicator": "/rest/projects/$projectId/md/indicators?name=turnover_indicator",
                "indicatorDrill": "/rest/projects/$projectId/md/indicatorDrills?name=empty_indicator_drill",
                "layout": "primary"
            }
        ]
    },
    "accessInfo": {
        "createdAt": "2020-06-23T17:26:08Z",
        "createdBy": "/rest/accounts/00ubfu7fdyIoFKxXm0h7"
    },
    "links": [
        {
            "rel": "self",
            "href": "/rest/projects/k5t8mf2a80tay2ng/md/dashboards/j2idsg8tq7icp62f"
        }
    ]
}
Use pushProject to upload the modified dashboard into the project.
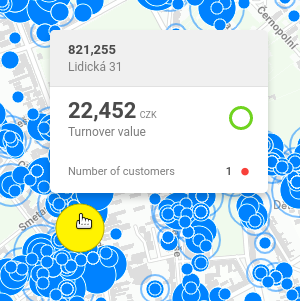
Now, there's a new indicator on the dashboard, and you are able to see the turnover values aggregated to the customer addresses.
This is nice. But what if we could aggregate the turnover to some administrative units?
Importing a data dimension
Data dimensions are specific projects that contain prepared data (e.g. administrative units or demography). They can be imported into other projects and combined with their data.
Most dimension projects contain only datasets and corresponding data. Some dimensions (e.g. administrative units) also have views to preview their contents.
We will import the administrative units' dimensions using the importProject command. This dimension contains the administrative units of the Czech Republic in 7 granularities - regions, counties, municipalities with extended competencies, municipalities, municipalities and city districts, city districts, and neighbourhoods. Each granularity is defined by two datasets - one DWH dataset, and one vector tile dataset. The DWH dataset contains data about the name of the administrative unit, its bounding box (the x_min, x_max, y_min, y_max properties) and foreign keys to the neighbouring granularities. The vector tile dataset contains a reference to a vector tile service, which contains the polygons for each administrative unit.
We will specify just the project ID of the administrative units dimension project - q1zdp9d0ao78rdv5. importProject command also offers the option to specify a prefix for all imported files or to import only parts of the project. We need just the datasets and the data from this dimension project, so we will use the --datasets parameter. The importProject command performs a data model validation using validate before the import itself.
tomas.schmidl@secure.clevermaps.io/project:k5t8mf2a80tay2ng/dump:$ importProject --project q1zdp9d0ao78rdv5 --datasets
Validating DWH model/data integrity of project q1zdp9d0ao78rdv5... OK

Importing project q1zdp9d0ao78rdv5...
Here, we omit a significant amount of the importProject command output for the sake of readability. This command wraps several other commands, whose output might not be that relevant to you. What is relevant is the result:
Import finished!
Source project: q1zdp9d0ao78rdv5 (can-dim-adm-units-cz-en)
Destination project: k5t8mf2a80tay2ng (First project)
Imported datasets: 21
Imported metadata objects: 0
Imported CSV files: 11

To view detailed imported content, use status command.
Now you can make changes, or import another project.
When you're done, use addMetadata command to add the metadata to the project.
To push the data to the project, use pushProject command.
The dimension has been successfully imported. You can review the import before pushing it into the project with status command.
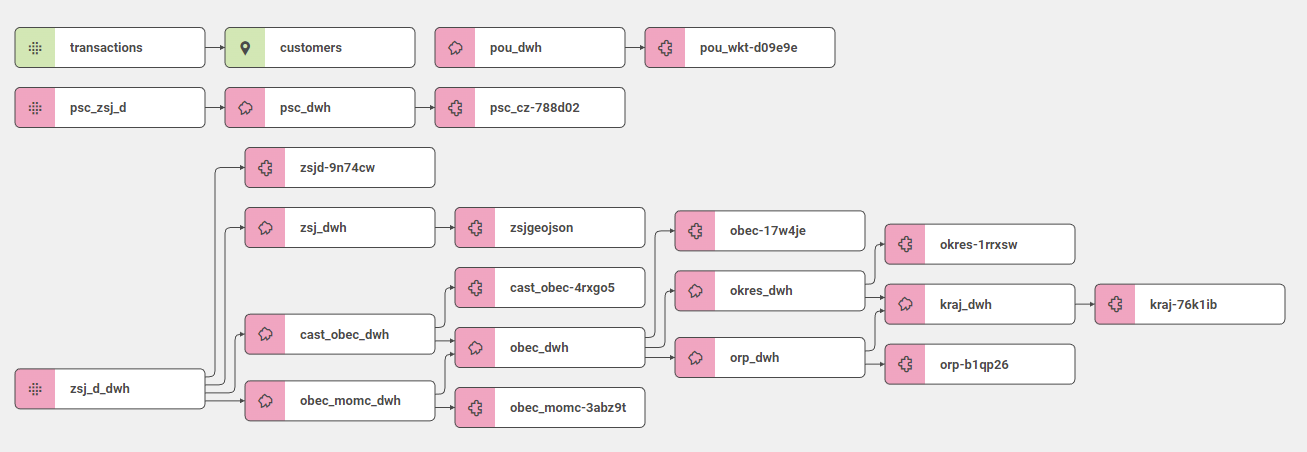
Then use addMetadata and pushProject to upload it into your project. Let's have another look at the data model. You can see the dimension datasets with pink labels.
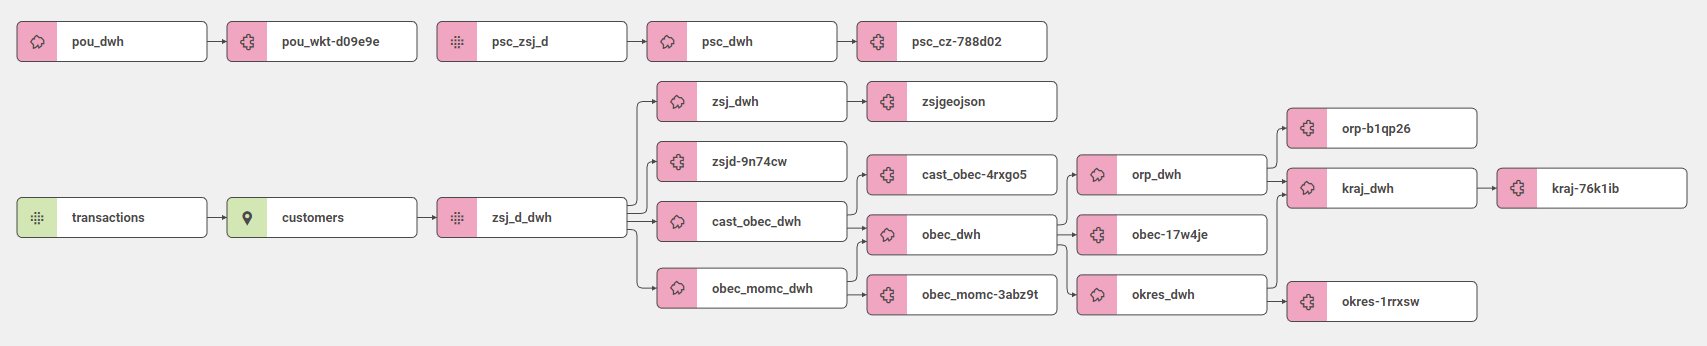
We just have to connect the customers dataset to the zsj_d_dwh dataset (Neighborhoods), which is the smallest administrative unit.
Modify the neighborhood_code property of customers dataset. Add foreignKey property to the zsj_d_dwh dataset.
Customers dataset excerpt
    ...
{
    "foreignKey": "zsj_d_dwh",
    "name": "neighborhood_code",
    "title": "Neighborhood code",
    "column": "neighborhood_code",
    "type": "string",
    "filterable": false
},
    ...
Use pushProject to push the changes. The data model should now look like this:
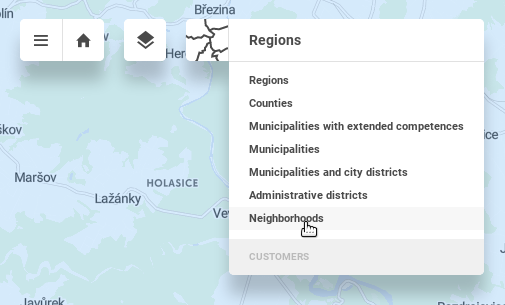
Open the Business overview view and see that the granularity has changed. Administrative units usually have multiple levels. By default, we see the biggest level - Regions. Change the granularity to Neighborhoods in the granularity drop-down menu in the upper left corner.
Visualize the Turnover value indicator to see the turnover aggregated to the Neighborhoods.
Optionally, set the defaultGranularity property to zsj_dwh in business_overview_view to view Neighborhoods by default.
Business overview view excerpt
  ...
    "content": {
        "icon": "shopping_cart",
        "dashboard": "/rest/projects/$projectId/md/dashboards?name=business_overview_dashboard",
        "defaultGranularity": "/rest/projects/$projectId/md/datasets?name=zsj_dwh",
        "mapOptions": {
  ...
That's it! In the next tutorial, we will extend our dashboard with more indicators, and we'll learn about additional dashboard features and formatting.