An indicator represents a phenomenon that can be displayed on a map. It allows the user to configure how the phenomenon will be displayed. Indicator has a reference to a metric, which is a mathematical expression of the phenomenon. Indicators are further analysed in indicator drills, with whom they are paired with and displayed in a dashboard.
With an object (marker or an area) selected, indicator also shows fitness on a mouse hover. Fitness ranks the object among others and also shows the percentile.
See the combinations of indicator scales and visualizations in action in the Features Catalog for Developers project.
Syntax
This is the Turnover value indicator from the Catchment Area view of the Retail Solution Demo.
You can see that it's linked to the turnover_metric. The colouring scale is standard, distribution of the values is geometric and the format of the value is set to display as British pound.
Indicator object syntax
{
    "name": "turnover_indicator",
    "type": "indicator",
    "title": "Turnover value",
    "description": "Total turnover of all purchases. It indicates how much money your customers have spent.",
    "content": {
        "metric": "/rest/projects/$projectId/md/metrics?name=turnover_metric",
        "scale": "standard",
        "distribution": "geometric",
        "visualizations": {
    		"heatmap": true,
            "dominance": true
		},
        "format": {
            "type": "number",
            "fraction": 0,
            "symbol": "£"
        }
    }
}
Example of a dumped indicator
{
    "url": "/rest/projects/yufqzxkbiecj7jot/md/indicators/ckhk3hursnbncsoo",
    "dumpTime": "2018-01-25T14:19:38Z",
    "version": "3",
    "content": {
        "id": "ckhk3hursnbncsoo",
        "name": "turnover_indicator",
        "type": "indicator",
        "title": "Turnover value",
        "description": "Total turnover of all purchases. It indicates how much money your customers have spent.",
        "content": {
            "metric": "/rest/projects/$projectId/md/metrics?name=turnover_metric",
            "scale": "standard",
            "distribution": "geometric",
            "visualizations": {
        		"heatmap": true,
                "dominance": true
		    },
            "format": {
                "type": "number",
                "fraction": 0,
                "symbol": "£"
            }
        },
        "accessInfo": {
            "createdAt": "2017-10-05T08:26:59Z",
            "modifiedAt": "2017-10-13T10:56:44Z"
        },
        "links": [
            {
                "rel": "self",
                "href": "/rest/projects/yufqzxkbiecj7jot/md/indicators/ckhk3hursnbncsoo"
            }
        ]
    }
}
Additional syntax examples
Example of an indicator with scaleOptions.static object
{
    "name": "turnover_indicator",
    "type": "indicator",
    "title": "Turnover value",
    "description": "Total turnover of all purchases. It indicates how much money your customers have spent.",
    "content": {
        "metric": "/rest/projects/$projectId/md/metrics?name=turnover_metric",
        "scale": "standard",
        "distribution": "geometric",
        "visualizations": {
    		"heatmap": true,
            "dominance": true
		},
        "format": {
            "type": "number",
            "fraction": 0,
            "symbol": "£"
        },
        "scaleOptions": {
            "static": [
                {
                    "dataset": "/rest/projects/$projectId/md/datasets?name=postcodes",
                    "breaks": {
                        "global": [
                            10000,
                            20000,
                            40000,
                            80000
                        ],
                        "selection": [
                            1000,
                            2000,
                            4000,
                            8000
                        ]
                    },
                    "maxValues": [
                        {
                            "zoom": 18,
                            "global": 100000,
                            "selection": 10000
                        }
                    ]
                }
            ]
        }
    }
}
This indicator has the content.scaleOptions.static object set. Few points to note:
-
if no
datasetis specified, the breaks will be applied to all datasets (all granularities) -
it's possible to specify either
globalorselectionvalues (or both, like in this example) -
the values specified in
breaksobject apply toareas,grid,zones,dotmapandlinevisualizations, whethermaxValuesapply only to theheatmapvisualization
Example of an indicator with scaleOptions.defaultDistribution object
{
    "name": "turnover_indicator",
    "type": "indicator",
    "title": "Turnover value",
    "description": "Total turnover of all purchases. It indicates how much money your customers have spent.",
    "content": {
        "metric": "/rest/projects/$projectId/md/metrics?name=turnover_metric",
        "scale": "standard",
        "distribution": "geometric",
        "visualizations": {
    		"heatmap": true,
            "dominance": true
		},
        "format": {
            "type": "number",
            "fraction": 0,
            "symbol": "£"
        },
        "scaleOptions": {
            "defaultDistribution": {
                "breaks": [
                    100000,
                    200000,
                    300000,
                    400000,
                    500000,
                    600000
                ],
                "displayIntervals": [
                    0,
                    1,
                    3,
                    4
                ]
            }
        }
    }
}
This indicator has the content.scaleOptions.defaultDistribution object set.
Key description
content
|
Key |
Type |
Optionality |
Description |
Constraints |
|---|---|---|---|---|
|
|
string |
required |
URL link to the metric object |
|
|
|
string |
optional |
sets the scale coloring, see the examples below default = |
|
|
|
string |
optional |
defines the distribution of the indicator values default = |
|
|
|
object |
optional |
object specifying available visualizations of the indicator |
|
|
|
object |
optional |
object specifying formatting of the indicator value |
|
|
|
object |
optional |
object specifying the relations of the indicator's metric |
|
|
|
object |
optional |
object specifying the scale options |
|
The scale key sets the coloring of the scale. Each scale fits a different use case and indicator values.
-
standardscale has 5 segments and is generally used for any indicator, e.g. average purchase value -
positivescale has 5 segments and is generally used for positive indicators, e.g. increase of customers -
negativescale has 5 segments and is generally used for negative indicators, e.g. decrease of customers -
inversescale has 5 segments and is the same asstandard, but the colors are flipped, it can be used to identify e.g. white spots on a map -
binaryStandardscale has 2 segments and is used the same way asstandard, but just for binary values, e.g. to indicate if there is a shop in the area, or not -
binaryNegativescale has 2 segments and is used the same way asnegative, but just for binary values, e.g. to indicate if the area had a decrease of customers, or not -
divergingStandardscale has 6 segments and is used for indicators that can positive and negative values, e.g. turnover value difference -
divergingNegativeis used the same way asdivergingStandardscale, but the colors are flipped, it can be used to indicate e.g. competition turnover value difference -
divergingWithZeroStandard,divergingWithZeroNegativescales have 5 segments, with a neutral middle segment -
heat,heatmap,traffic,trafficInverse,magma,viridisscales have 5 segments
See the scales coloring visual representation below.
The distribution affects the intensity of the coloring from the beginning to the end of the scale. The rule of thumb when picking the correct distribution is to try them both, and see what works best for each indicator.
content.visualizations
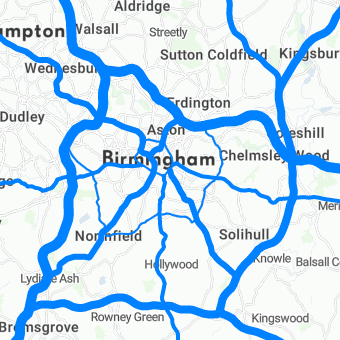
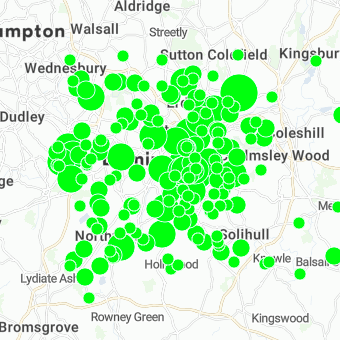
An indicator can have multiple types of visualizations. Currently, we offer six types of visualizations:
-
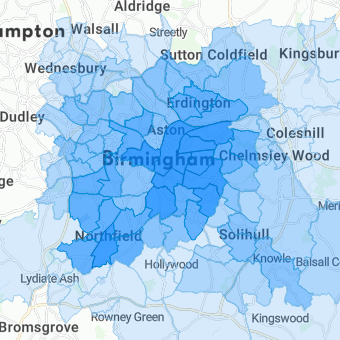
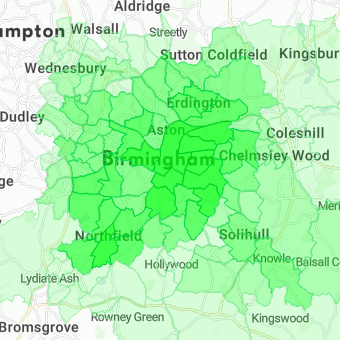
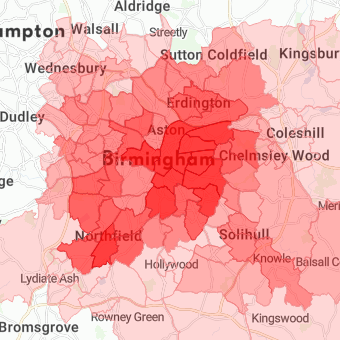
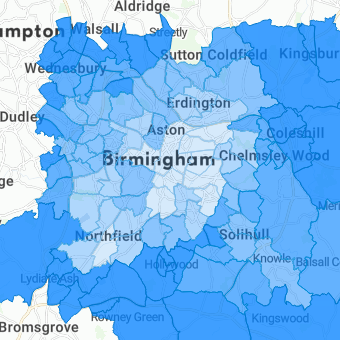
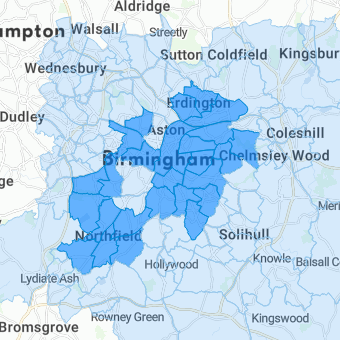
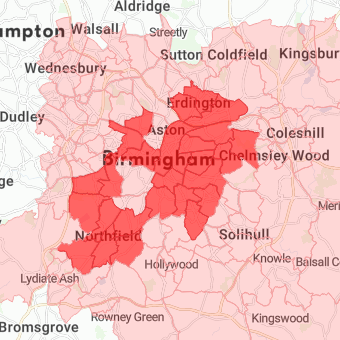
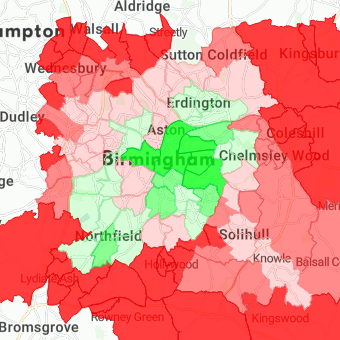
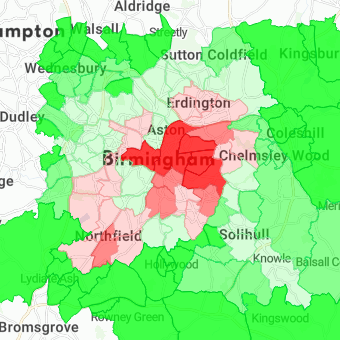
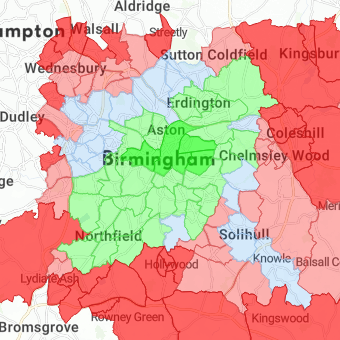
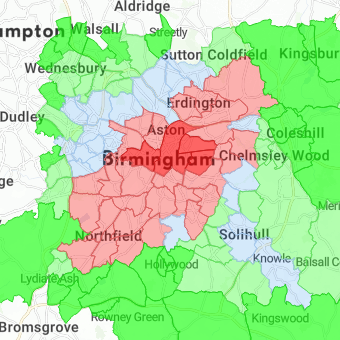
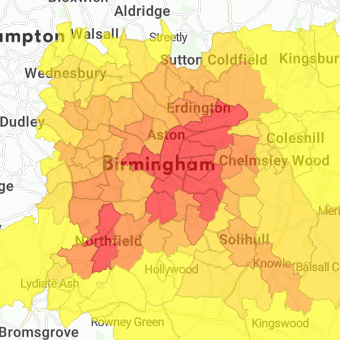
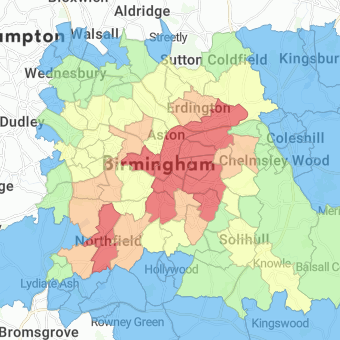
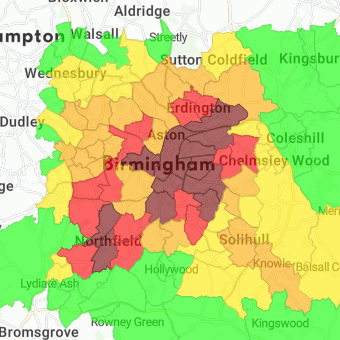
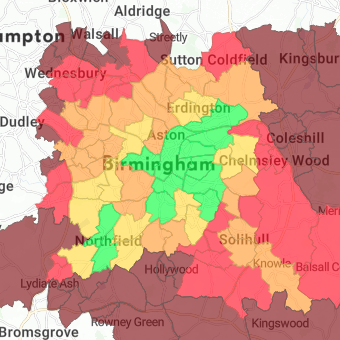
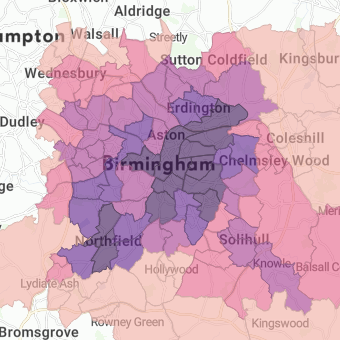
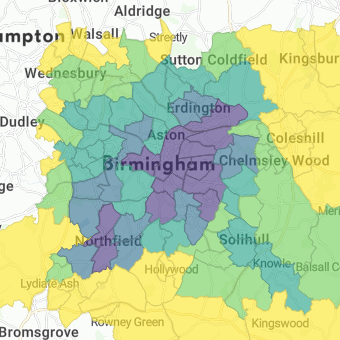
areas(based ongeometryPolygonsubtype dataset) -
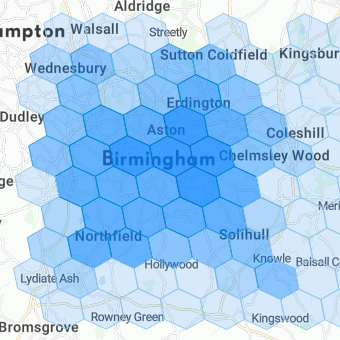
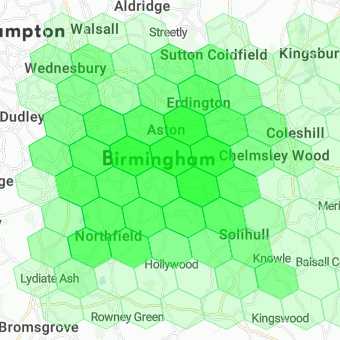
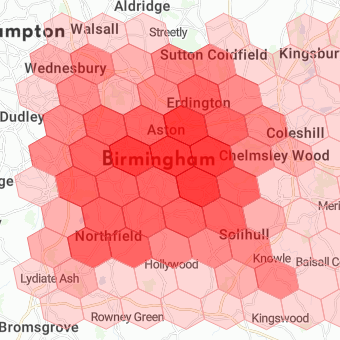
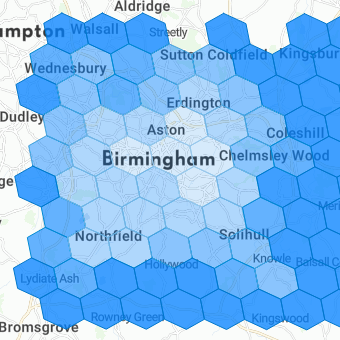
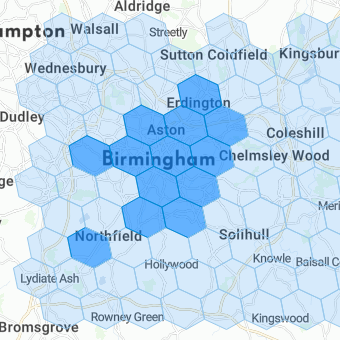
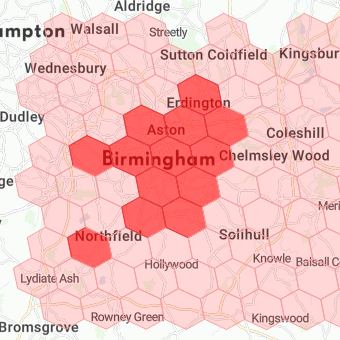
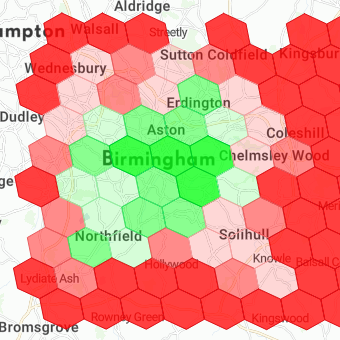
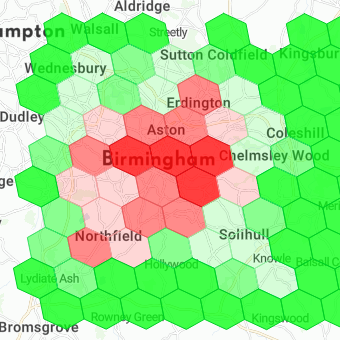
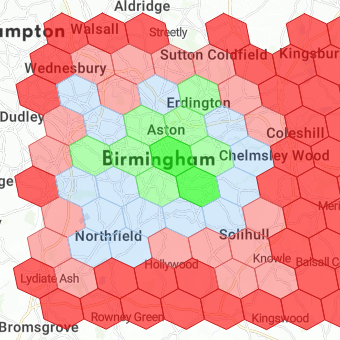
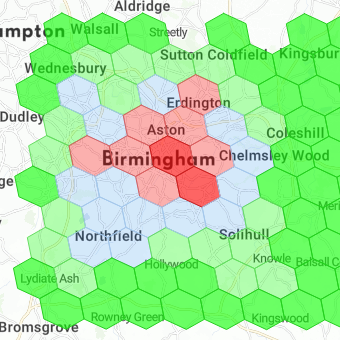
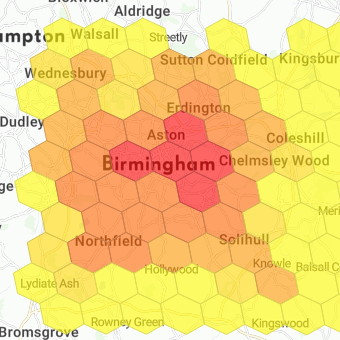
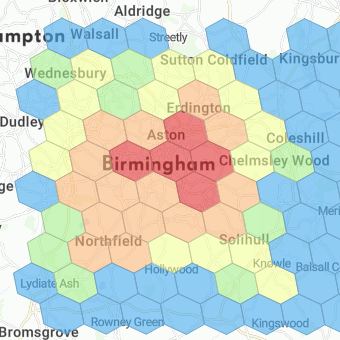
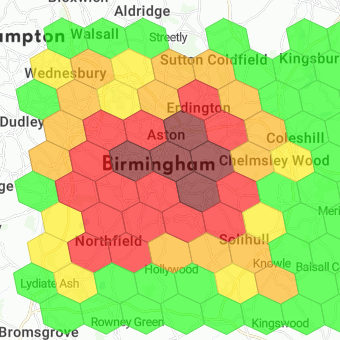
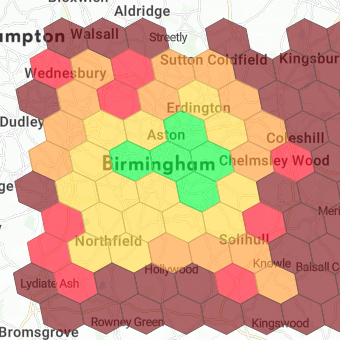
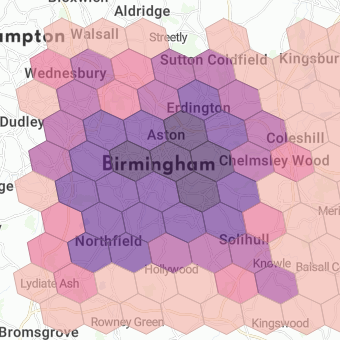
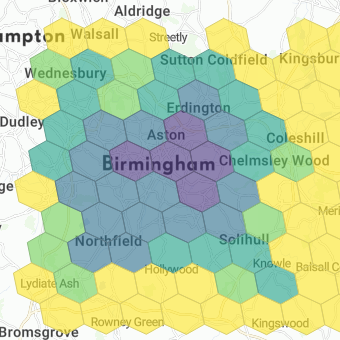
grid(based ongeometryPolygonsubtype dataset) -
zones(based ongeometryPolygonsubtype dataset) -
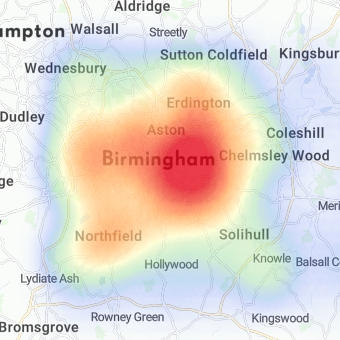
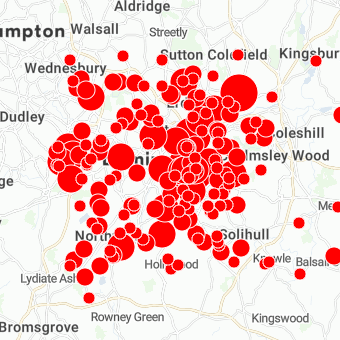
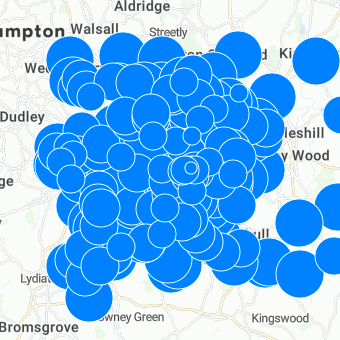
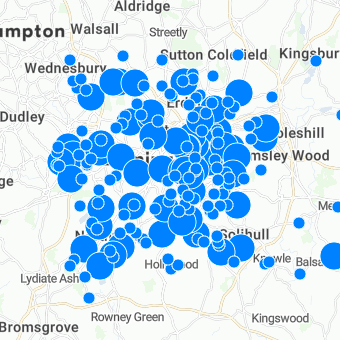
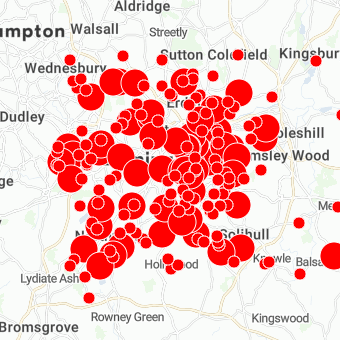
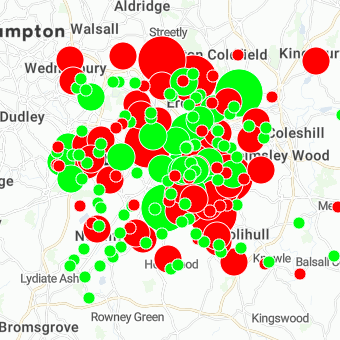
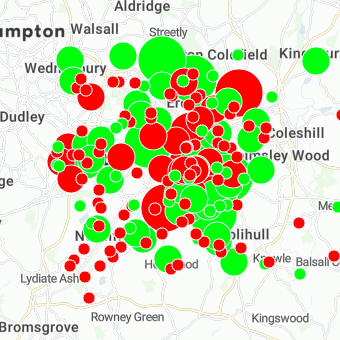
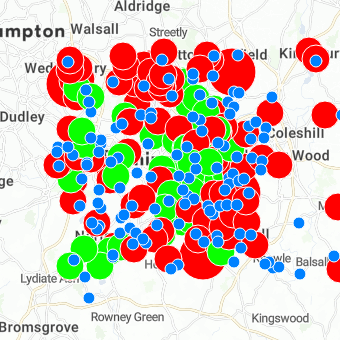
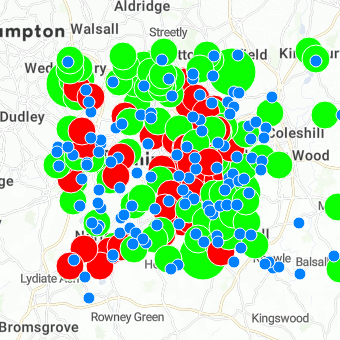
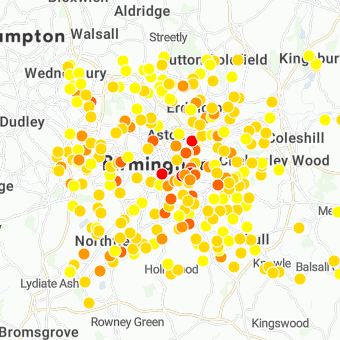
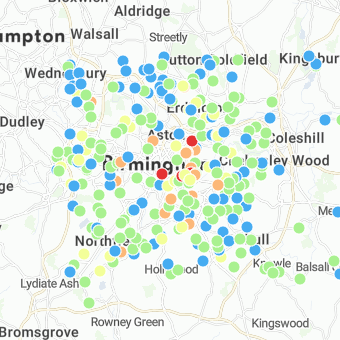
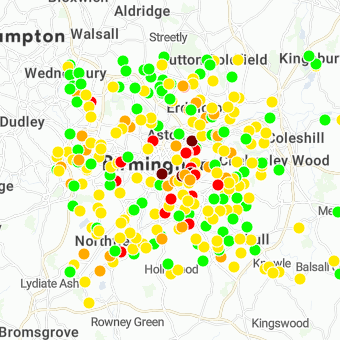
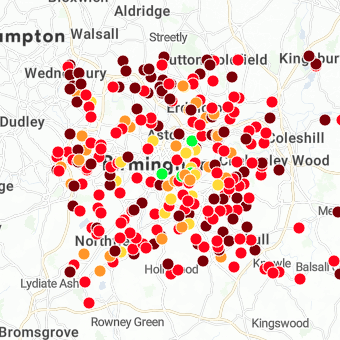
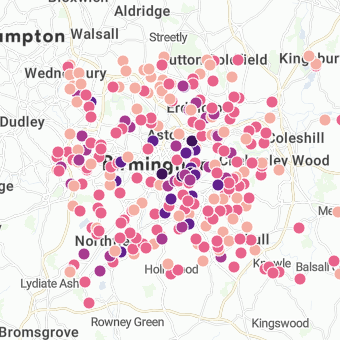
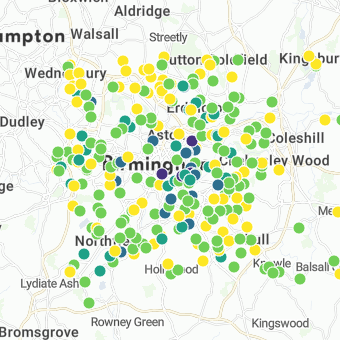
heatmap(based ongeometryPointsubtype dataset) -
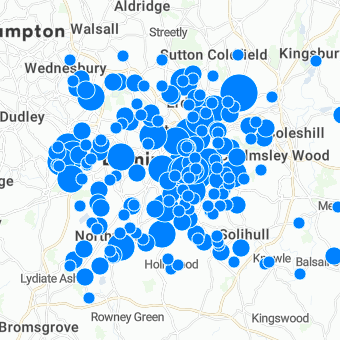
dotmap(based ongeometryPointsubtype dataset) -
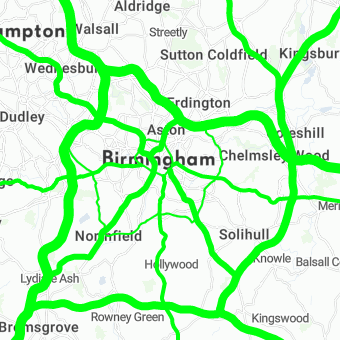
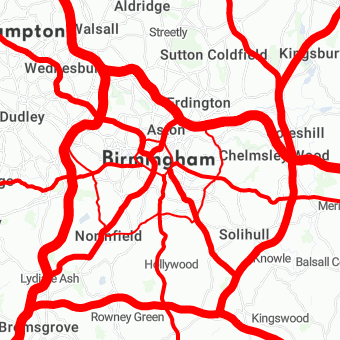
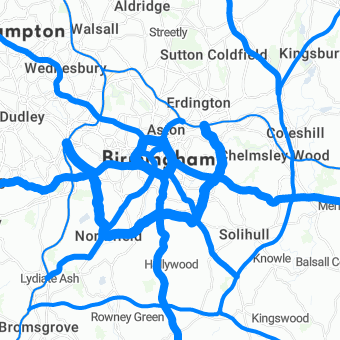
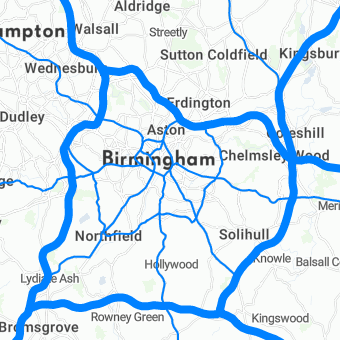
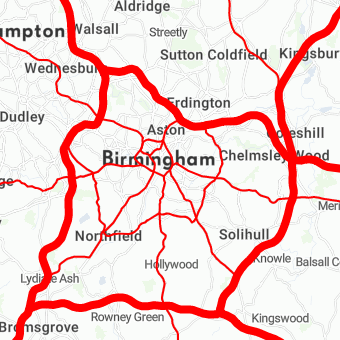
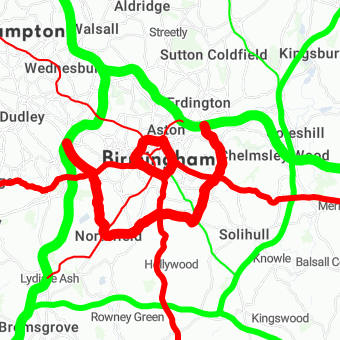
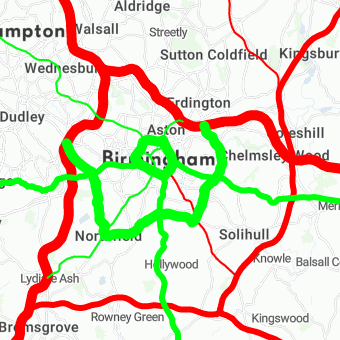
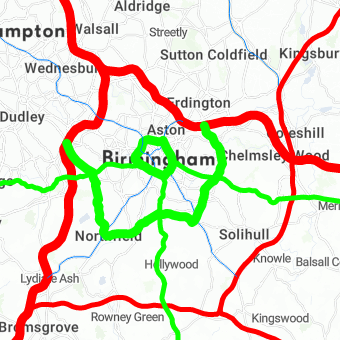
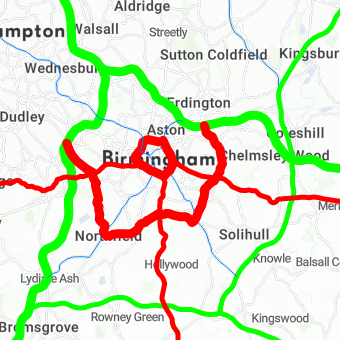
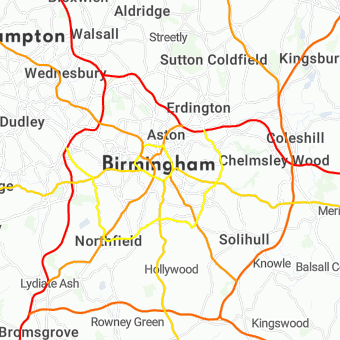
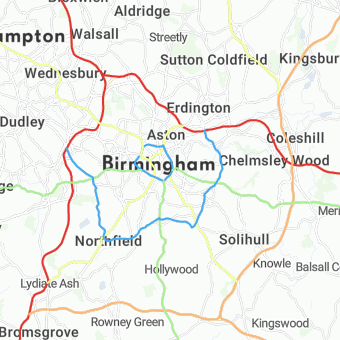
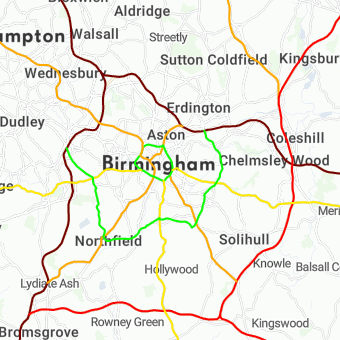
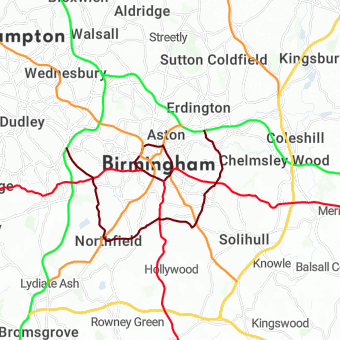
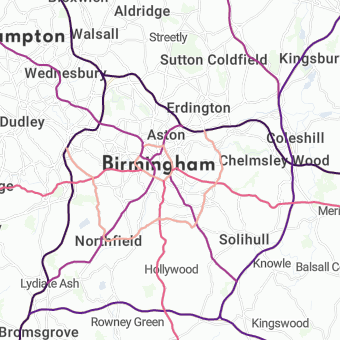
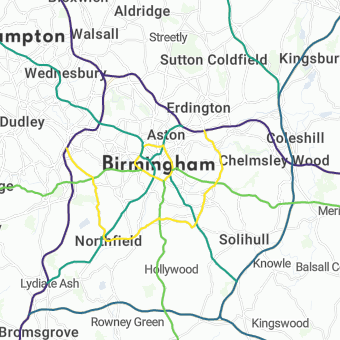
line(based ongeometryLinesubtype dataset)
|
|
|
|
|
|
|
|---|---|---|---|---|---|
|
|
|
|
|
|
|
This object also enables Dominance visualization in the Compare tool ( ![]()
See the visualization examples below.
|
Key |
Type |
Optionality |
Description |
Constraints |
|---|---|---|---|---|
|
|
boolean |
optional |
enables areas visualization |
|
|
|
boolean |
optional |
enables grid visualization |
|
|
|
boolean |
optional |
enables zones visualization |
|
|
|
boolean |
optional |
enables heatmap visualization |
|
|
|
boolean |
optional |
enables dotmap visualization |
|
|
|
boolean |
optional |
enables line visualization |
|
|
|
boolean |
optional |
enables the dominance visualization in the Compare tool |
|
|
|
decimal |
optional |
sets the scale factor of a heatmap visualization |
x => 0.0 |
For a geometryPoint dataset to appear as a visualization type, the dataset must not be mentioned in any of the view's marker selectors (e.g. typically datasets representing stores, ATMs, etc.).
content.format
|
Key |
Type |
Optionality |
Description |
Constraints |
|---|---|---|---|---|
|
|
string |
required |
type of the format the |
|
|
|
integer |
optional |
the number of places after the decimal point |
x => 0 |
|
|
string |
optional |
|
|
content.relations
Used in the case of departures/arrivals metrics. The details can be found in here.
|
Key |
Type |
Optionality |
Description |
Constraints |
|---|---|---|---|---|
|
|
string |
required |
type of the relation |
|
|
|
string |
required |
URL link to the reversed metric object |
|
content.scaleOptions
This object is used to set the options of the indicator scale. It allows you to set the default values of its corresponding indicator drill's distribution block.
See complete indicator example above.
|
Key |
Type |
Optionality |
Description |
Constraints |
|---|---|---|---|---|
|
|
array |
optional |
array of static specifies the default settings of a |
x => 0 |
|
|
object |
optional |
specifies the default settings of a |
|
content.scaleOptions.static
This object sets the inner breaks of the scale interval. These breaks do not change when a filter is applied.
|
Key |
Type |
Optionality |
Description |
Constraints |
|---|---|---|---|---|
|
|
string |
optional |
URL link to the dataset representing a granularity, on which the breaks will be applied only if not specified, the breaks will be applied to all datasets (all granularities) |
|
|
|
object |
required |
object representing the break values |
|
|
|
array |
optional |
array of maximal values for the |
x => 0 |
content.scaleOptions.static.breaks
The values specified in breaks apply to the areas, grid, zones, dotmap and line visualizations.
|
Key |
Type |
Optionality |
Description |
Constraints |
|---|---|---|---|---|
|
|
array |
optional |
array of distribution break values (integer or decimal) these breaks will be applied when no object is selected |
|
|
|
array |
optional |
array of distribution break values (integer or decimal) these breaks will be applied when an object is selected (area or a marker) |
|
content.scaleOptions.static.maxValues
Values used for tuning the scale of the heatmap visualization. When maxValues are specified, the content.visualizations.heatmapScaleFactor property is ignored.
|
Key |
Type |
Optionality |
Description |
Constraints |
|---|---|---|---|---|
|
|
integer |
required |
zoom level, for which the |
|
|
|
decimal |
optional |
global scale value (= no marker selected) |
|
|
|
decimal |
optional |
selected scale value (= when a marker is selected) |
|
content.scaleOptions.defaultDistribution
This object allows you to set the default values (including outer breaks) of the indicator's corresponding indicator drill's distribution block. These settings are reset when a filter is applied.
|
Key |
Type |
Optionality |
Description |
Constraints |
|---|---|---|---|---|
|
|
array |
optional |
array of exactly 2 elements representing distribution range, i.e. lowest and highest value (integer or decimal) |
|
|
|
array |
optional |
array of distribution break values (integer or decimal) |
|
|
|
array |
optional |
specifies which scale intervals should be displayed |
|
Visual representation
Indicators are represented as a list of cards in a dashboard.
Turnover value indicator
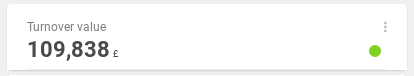
In this area, the turnover value in selected time frame is 688,424 £.
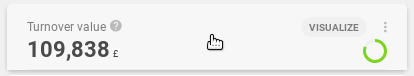
Turnover value indicator after a mouse hover
Turnover value indicator with a mouse hover on the fitness
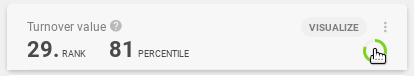
This ranks the area as 16th, which gives it a 90 percentile.
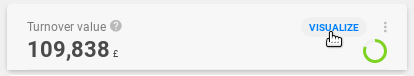
Turnover value indicator with a mouse hover on the Visualize button
Three indicators in a specific area
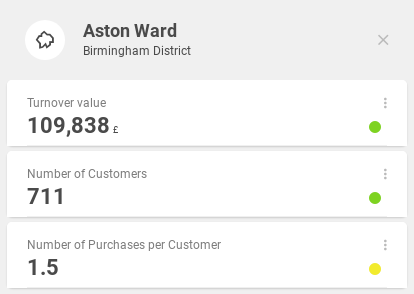
Here, we see an area - Oscott ward in the Birmingham district, described by three indicators. They tell us that a total of 912 customers live in this area, and the average number of purchases per customer is 1.20. In the selected time frame, these customers generated 104,497 £ turnover.
Indicator scales and visualizations
These are the possible combinations of indicator scale and visualizations. Please note that the heatmap visualization is only available with a standard scale.
|
scale / visualization |
|
|
|
|
|
|
|
|
|
|
|
|
|
|
|
|
|
|
|
|
|
|
|
|
|
|
|
|
|
|
|
|
|
|
|
|
|
|
|
|
|
|
|
|
|
|
|
|
|
|
|
|
|
|
|
|
|
|
|
|
|
|
|
|
|
|
|
|
|
|
|
|
|
|
|
|
scale / visualization |
|
|
|
|
|
|
|
|
|
|
|
|
|
|
|
|
|
|
|
|
|
|
|
|
|
|
|
|
|
|
|
|
|
|
|
|
|
|
|
|
|
|
|
|
|
|
|